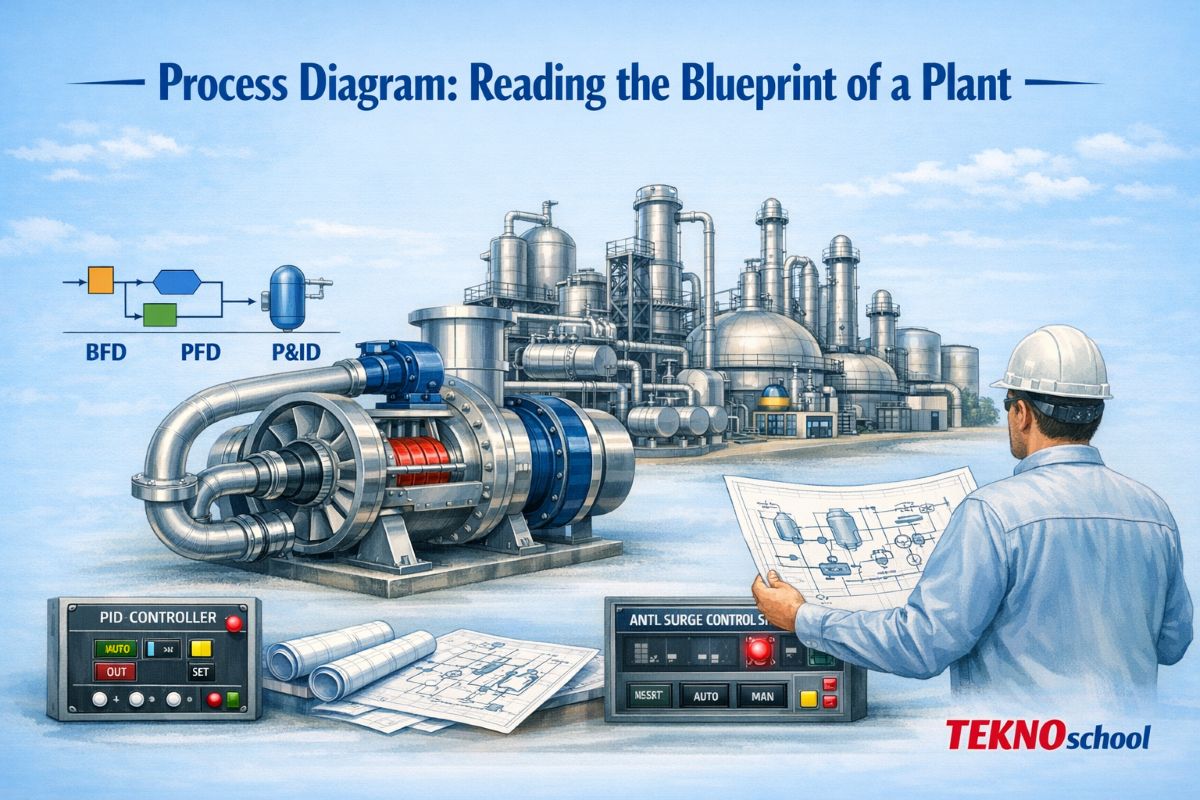
Process Diagram Reading the Blueprint of a Plant
Before a single pipe is welded or a pump installed, a chemical plant lives entirely on paper — on a hierarchy of increasingly detailed diagrams that carry every decision from concept to construction. Understanding how to read and draw these process diagram is, arguably, the most fundamental skill a process engineer can possess.
Imagine you’ve just joined a mid-sized chemical company. On your first morning, your manager slides a large rolled drawing across the desk and says, “Tell me what’s happening here.” If you can decode that drawing — follow the streams, identify the equipment, read the control loops — you’re already speaking the language of the plant. If you can’t, you’re essentially illiterate in the most important dialect your job demands.
There are three diagrams every chemical engineer must master. Each represents a different zoom level, a different stage of knowledge, and a different audience. Together they form a complete documentary record of a chemical process from birth to old age.
Block Flow Diagram
The “napkin sketch” — boxes and arrows that capture the essence of a process without drowning in detail. Used to compare alternatives and pitch ideas early.
Conceptual Stage
Process Flow Diagram
The engineer’s workhorse. Every piece of major equipment, every stream with temperature, pressure, and composition. Material and energy balances live here.
Design Stage
Piping & Instrument Diagram
The construction bible. Pipe sizes, valve types, instrument tags, control loops — everything needed to actually build and operate the plant safely.
Construction Stage
01 — Block Flow Diagram
Where Every Process Begins
The block flow diagram (BFD) is deceptively simple: rectangles connected by arrows, a few numbers scrawled beside the lines, maybe a temperature or a conversion percentage. And yet the BFD is where hundreds of decisions get made before anyone ever picks up a process simulator or opens a heat exchanger rating program.
Consider the production of benzene via the catalytic hydrodealkylation of toluene — a real, well-studied industrial process. In this reaction, toluene and hydrogen are fed into a reactor where they convert to benzene and methane. The reaction doesn’t go to completion, so excess toluene must be fed, unreacted toluene must be separated and recycled, and non-condensable gases must be vented.
A BFD for this process shows just three blocks: a Reactor, a Gas Separator, and a Distillation Still. Three arrows in, two arrows out, a recycle loop, and a handful of flowrate numbers. In the time it takes to read one paragraph, an engineer can see the entire logic of the process — what goes in, what comes out, and why. That clarity is the BFD’s superpower.
A BFD can represent either a single process (block flow process diagram) or an entire chemical complex of many interconnected processes (block flow plant diagram). The coal-to-higher-alcohol-fuels plant, for example, involves gasification, gas cleaning, synthesis, and separation — each a complete process, yet representable in one bird’s-eye BFD.
BFDs are also the workhorse of early economic screening. By associating rough costs with each block, engineers can compare competing synthesis routes for the same product — or kill off a commercially unviable idea — without spending months on detailed engineering. At this stage, the cost of being wrong is just a few hours of thought. Later, it will be millions of dollars.
02 — Process Flow Diagram
The Engineer’s Master Document
If the BFD is a sketch, the Process Flow Diagram (PFD) is a portrait — detailed, precise, and rich with information. Every major piece of equipment appears, represented by standardised icons. Every process stream carries a number, indexed to a flow summary table that lists temperature, pressure, vapour fraction, total flow rate, and the molar flow rate of each chemical component. Major control loops are shown. Utility connections are labeled.
The benzene process PFD illustrates just how much information one diagram can carry. Typical From a toluene storage drum (V-101) through feed pumps (P-101A/B), a feed preheater (E-101), a fired heater (H-101), a reactor (R-101), a recycle compressor (C-101A/B), two phase separators (V-102, V-103), and a benzene distillation column (T-101) complete with condenser, reflux drum, and reboiler — all connected by numbered streams, each fully described in the accompanying flow summary table.
Numbered Streams
Equipment Items
Toluene Conversion per Pass
Reactor Temperature
Equipment Naming: A Universal Code
One of the most elegant features of a PFD is its equipment naming convention. Every item follows the format XX-YZZ A/B — and once you learn the alphabet, you can decode any plant’s equipment list instantly. The letters identify the type, the number identifies the plant area and sequence, and the A/B suffix signals that a backup unit is installed.
| Code | Equipment Type | Plant Example |
|---|---|---|
| C | Compressor or Turbine | C-101A/B — Recycle Gas Compressor with backup |
| E | Heat Exchanger | E-102 — Reactor Effluent Cooler (773 m² area) |
| H | Fired Heater | H-101 — Feed Heater (duty: 28,040 MJ/h) |
| P | Pump | P-101A/B — Toluene Feed Pumps (spare installed) |
| R | Reactor | R-101 — Hydrodealkylation Reactor, 690°C, 25 bar |
| T | Tower / Distillation Column | T-101 — Benzene Column, 27 m tall, 42 sieve trays |
| TK | Storage Tank | TK-101 — Atmospheric storage vessel |
| V | Vessel / Drum / Separator | V-102 — High-Pressure Phase Separator, 23 bar |
Stream Information: The Life of the Process
For every numbered stream on the PFD, the flow summary table records temperature, pressure, vapour fraction, total mass flow rate in tonnes per hour, total molar flow rate in kmol/h, and the individual molar flow rate of each chemical component. This is where material balance checks happen, where conversion calculations are verified, and where operating problems are first diagnosed from the desk.
Take a simple verification: checking the overall material balance for the benzene process. This rapid verification is only possible because the PFD and its tables make every number visible and traceable.
The most effective way of communicating information about a process is through the use of flow diagrams.
Utility Streams: The Invisible Infrastructure
Running parallel to process streams on any PFD is the utility network — steam, cooling water, fuel gas, and other services that add or remove heat and power from the process. These appear as labeled connections using standardised abbreviations directly on the diagram at every point of use.
03 — Piping & Instrumentation Diagram
The Construction Guide
When the PFD is approved and the process design is fixed, work begins on the most detailed of all plant documents: the Piping and Instrumentation Diagram, universally known as the P&ID. Where a complex process might require a handful of PFDs, the same process can easily generate 50 to 120 P&IDs — one covering perhaps a single distillation column and its associated equipment, drawn at a level of detail that would be overwhelming if applied to the whole plant at once.
The P&ID shows every mechanical aspect of the plant that the PFD does not: pipe diameters and schedule numbers, materials of construction for every line, every valve, whether manual or automated, drain lines and sample connections, instrument tags for every measurement and controller, and spare equipment that might not appear on the PFD at all. Even the physical size of large equipment is reflected in the size of its symbol on the diagram.
Reading an Instrument Loop
The instrumentation notation on a P&ID follows the ISA-S5.1 standard and uses a clever two-part letter code. The first letter identifies the measured variable — L for Level, T for Temperature, F for Flowrate, P for Pressure. The second letter identifies what is done with that measurement — I for Indicate, C for Control, T for Transmit, R for Record.
Consider the benzene product withdrawal loop from the distillation reflux drum (V-104). A level sensing element (LE) on the drum measures liquid level and sends a signal via a level transmitter (LT) to a Level Indicator Controller (LIC) in the control room. The LIC computes the required valve position via a relay (LY) and sends a pneumatic signal to a Level Control Valve (LCV) on the product line. Two alarms — LAH (Level Alarm High) and LAL (Level Alarm Low) — also receive the transmitter signal and alert operators before problems escalate.
In virtually all chemical process control, the final control element is a valve. Every control loop ultimately manipulates a flow rate to control some process variable — temperature, level, pressure, or composition. Understanding which flow rate is being changed, and in which direction, unlocks the logic of any control scheme.
04 — Beyond Construction
Diagrams That Never Retire
A common misconception is that process diagrams are tools of the design phase — useful until the plant starts up, then filed away. The opposite is true. These diagrams are living documents that follow a plant through its entire operating life, sometimes spanning decades.
Raw material quality drifts over time. Product specifications tighten. Environmental regulations evolve. Better catalysts become available. Equipment wears and is replaced. Each change updates the diagrams — and the updated diagrams become the new baseline for understanding what the plant is actually doing, rather than what it was designed to do. When an engineer is asked to troubleshoot a recurring pressure drop problem or debottleneck a unit for higher throughput, it is the PFD and P&ID they reach for first.
The diagrams are also central to operator training. Before a new operator is trusted to make valve adjustments on a live plant, they work through the P&IDs to understand every control loop and every consequence. Plant simulators — analogous to aircraft flight simulators — present process upsets and require the trainee to identify the correct valve response by following the logic on the diagram. The more clearly the P&ID is drawn, the faster that understanding develops.
Perhaps most critically, the P&ID governs start-up procedures. When a column is being brought online for the first time, the process control systems are not yet in charge. The engineer works manually through a sequence — which valve opens first, what temperature must be reached before the next step, when to switch to automatic control — and every step of that sequence is derived from the P&ID.
Key Takeaway
Three Diagrams, One Story
The BFD, PFD, and P&ID are not three separate tools — they are three chapters of the same story, told at increasing magnification. The BFD asks: What does this process do, and is it worth doing? The PFD asks: How exactly does it work, and what are all the numbers? The P&ID asks: How do we build it, control it, and operate it safely?
A chemical engineer who can fluidly read all three — who can trace a toluene molecule from storage drum through reactor and distillation column to product tank, identify the instruments that monitor it, and understand the control loops that keep it on specification — possesses a skill that no simulation software can replace. The diagrams are the language. Fluency in that language is what turns chemistry into industry.