
Project Management 3
Project Management 3-There is an old instruction that survives because it is difficult to improve on: plan the work, then work the plan. Almost every serious project failure can be traced back to a violation of one half of that sentence or the other — either the plan was never good enough to be worth following, or a perfectly good plan was abandoned the moment reality applied pressure. This guide covers the machinery that turns an authorised project into an executable one: the Project Management Plan, the start-up process, success criteria, scope definition and the Work Breakdown Structure, and then the full scheduling toolkit — network diagrams, dependency types, lead and lag, the forward and backward pass, critical path, float, and Gantt charts.
1. Planning and Control: Two Halves of One Job
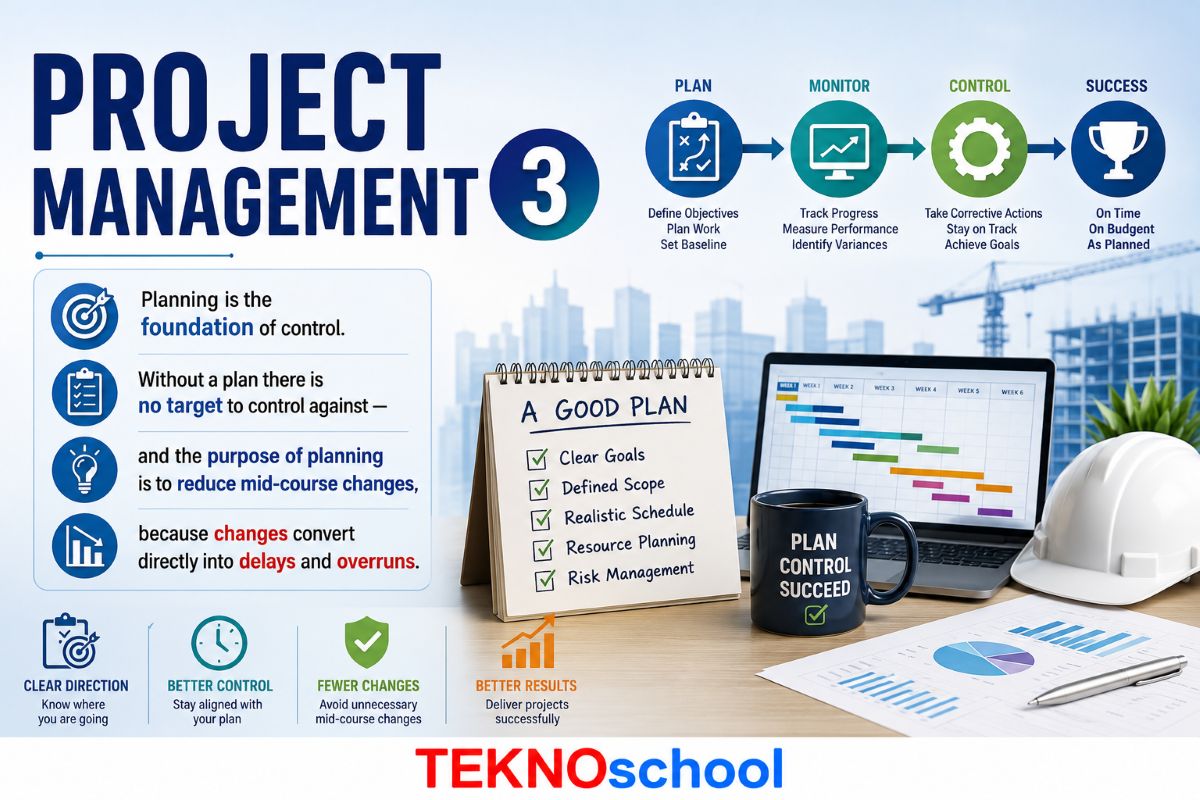
Planning and control are the two key elements of project management, and the relationship between them is strictly sequential. In planning we examine the situation, decide what we intend to do, and work out how we intend to do it. In control we actually execute that plan. Planning is therefore the foundation of control — without a plan there is nothing to control against and no target to aim for.
The ultimate purpose of planning is to avoid or reduce mid-course changes, because too many changes produce exactly two things: time delays and cost overruns. This is not a theoretical concern. When Japanese industry set out to make its mark on the world in the late 1960s, it placed enormous emphasis on detailed, well-considered plans and on meticulous execution of those plans. The reasoning was practical rather than philosophical: in terms of resource mobilisation, following a settled plan is far less painful than keeping the plan permanently open-ended.
The project manager’s specific task at this stage is a conversion job. The Project Charter and the Business Case contain the mission, the vision and the high-level requirements. The manager takes those documents and converts them into a detailed Project Management Plan.
2. The Project Management Plan
All the detailed planning done for the various aspects of a project is integrated into a single document known as the Project Management Plan — often shortened to the project plan. It is used to control the project and it acts as the baseline plan. Once the manager and team have finalised it, it should be approved by the project’s sponsor.
A useful way to remember what the plan must establish is as six questions.
| Question | What It Establishes |
|---|---|
| WHY | Comes directly from the Business Case — the justification for the project’s existence. |
| WHAT | Together with the “why”, this forms management’s statement of the success criteria, and it must be agreed with the project sponsor. |
| WHO | Who will perform the work, and the extent of stakeholder awareness of the project. |
| WHEN | The schedules and the phasing of the project. |
| HOW | The project manager’s vision for implementing the project from beginning to end — IT requirements, tools and techniques, validation of deliverables, technical issues, risk management, resources, procurement and quality needs. |
| HOW MUCH | The costs and budgets of the project. |
The plan is not written once. It is iterated many times, growing in detail as more information becomes available. Everything from the initial project brief and vision through to the objectives and deliverables, the Statement of Work, the Business Case and the Project Charter feeds into its development.
What Goes Into the Plan
| Category | Contents |
|---|---|
| Framing | An executive summary highlighting the key aspects of the project; the benefits expected along with the Success Criteria. |
| Scope and structure | The scope of the project and the Statement of Work; a full list of all deliverables ordered by time with their responsible owners; the Work Breakdown Structure and the Product Breakdown Structure. |
| Schedule | The time schedule of work with its important milestones, typically recorded as a consolidated bar chart derived from the network. |
| Subsidiary plans | Scope, schedule, cost, quality, communications, risk, procurement and staffing management plans. |
| People and responsibility | The organisation’s structure, roles and responsibilities; the Responsibility Matrix, produced by combining the WBS with the Organisational Breakdown Structure to fix project responsibilities. |
| Control mechanisms | Reporting procedures and standards; the document distribution schedule — which reports go to whom, how often, in what format; change control and configuration management; risk response strategies. |
| Technical and legal | Technical and commercial details; the tools, techniques and hardware to be used; Health, Safety and Environment policies; guarantees, liabilities and applicable laws. |
| Loose ends | Any open or pending issues and all exclusions; the commitment and agreement section recording task owner commitments and the project manager’s acceptance of them. |
The Subsidiary Plans in Detail
| Subsidiary Plan | What It Defines |
|---|---|
| Risk | Stakeholder risk tolerances, risk categories, roles and responsibilities, and how risk management will be structured and performed. |
| Quality | The quality requirements and how they will be met; metrics for quality control; frequency of audits and inspections; acceptance criteria. |
| Communication | The detailed communication needs of all stakeholders; how information will be gathered; what reports go to whom, how, and how often; meeting schedules. |
| Cost | Rounding rules and precision level; units of measure for costs such as staff hours, staff days or weeks; the currency for each resource; the formats to be used for cost reports. |
| Change | How all changes will be managed within the project. |
| Schedule & HSS | The schedule management plan, plus a health, safety and security plan for the project. |
Once written, the plan does a great deal of work. It guides execution; documents the assumptions made during planning and the reasoning behind the alternatives selected; facilitates communication between stakeholders; defines key management reviews in terms of content, extent and timing; provides the baseline for progress measurement and control; supplies the team and management with guidelines on development phases and estimates for cost, schedule and resources; and serves as the reference point for quality expectations regarding the project’s output.
3. Project Start-Up
There is a useful distinction hiding in the vocabulary here. Project start denotes a particular point in time at which the project begins. Project start-up denotes a course of action taking place over a period. The start-up process runs from the moment the decision to proceed is made until sufficient conditions exist for efficient cooperation between participants and proper management of the project’s direction.
It is characterised, memorably, by three things: unqualified expectations, great uncertainty, and considerable time pressure. Core team members and their roles are identified, equipment is procured and staff acquired, with further members inducted as required.
The 5% rule for fine-tuning
Fine-tuning of the plan normally happens during start-up, absorbing changes arising from management reviews or contract negotiations. Only minor changes belong at this stage — refinement of activities, addition of oversight and quality activities, small alterations to the schedule. Any change producing more than a 5% increase in cost or more than a 5% change in schedule must be treated as a major change, which means going back to detailed planning.
The first step of start-up is to finalise the plan and establish the baseline — a plan that has been finalised and approved, then taken as the base for execution so that subsequent changes are not random but flow through the change control process. The plan is finalised by the Steering Committee; resources are committed; and final approval may be required from the project manager, the Steering Committee and user management. Where contractors are involved, the prime contractor and the procurement agency may also need to sign off. Steering Committee approval represents a commitment to implement the project strictly as planned — a commitment to scope, schedule and budget simultaneously.
What Start-Up Delivers
| Deliverable Area | Detail |
|---|---|
| Documentation | Detailed schedules, procedures and rules; structured, edited and graphically presented documents for managing the project. These may form part of a Project Handbook and a Project Management file. |
| Analysis | Detailed analysis of expectations and potential risks; detailed planning of activities, resources, quality control, facilities and communications. |
| Human factors | Participants’ insights, ownership and personal relations; clear role division between project manager, owner or sponsor, and others contributing to start-up. |
| Shared understanding | Clarification of the plan and promotion of a shared perception and acceptance of it by team members and stakeholders. One or more Start-Up Workshops are organised to promote communication and involvement, often with a neutral facilitator whose task is to promote and monitor the cooperation process. |
| Boundaries | Establishing and maintaining the scope and boundaries of the project specifically to avoid future scope creep; clearly defining objectives and potential outcomes and ensuring they are shared by all key stakeholders and team members. |
| Team formation | Defining team roles and responsibilities and selecting a competent team with an excellent blend of skills and attitude; securing top management support for the change the project represents. |
Two further start-up activities are worth noting. On staffing, the manager negotiates which personnel are assigned and when they will be available, evaluates their skills, competencies and training needs, assesses any risks in using the staff assigned, and ensures new personnel are properly briefed on their roles. On team review of requirements, every team member benefits from reading the requirement documents and the plan so as to understand the full scope of work — usually handled through a kick-off meeting, with regular orientation meetings on larger projects. The objectives are to review system specifications, milestones, procedures and standards, to build an understanding of the whole system before work begins, and to develop genuine buy-in and ownership of the end product.
4. Success Criteria and Key Performance Indicators
Success Criteria are the qualitative and quantitative measures used to judge whether a project succeeded. A project is considered successful when the value achieved against these measures exceeds a predefined hurdle rate, either during execution or at completion. They are unique to each project, they should be discussed and clearly stated in the initial phase — doing so measurably increases the probability of success — and they should be reviewed at the end of every phase to confirm they can still be met.
The traditional view held that a project succeeded if it finished on time, within budget, and met the required quality criteria. That is no longer considered sufficient. Stakeholders now weigh many other factors, and critically, different stakeholders apply different success criteria to the very same project.
| Stakeholder | What “Success” Means to Them |
|---|---|
| Sponsor | Meeting the business needs for which the project was undertaken, and making a profit. |
| Customer | Specifications, reliability and safety being met by the delivered product. |
| Project manager and team | Meeting the project’s time, cost and quality parameters. |
Because these views diverge, the success criteria must be clearly defined with all stakeholders before the project begins. A further complication: stakeholders apply different time horizons when judging success — some assess at the moment of completion, others years afterwards.
Key Performance Indicators are the values of the success criteria that can be measured as the project progresses, allowing corrective action to be taken in time. They serve to gauge the likelihood of success while there is still opportunity to influence it, rather than delivering a verdict after the fact.
| INTERNAL Success Criteria | EXTERNAL Success Criteria |
|---|---|
| Project is profitable for the owner Owner or sponsor is satisfied Shareholder value has increased Consumers are satisfied Project completed on time Project meets the required quality Completed within cost Project meets the required functionality The project team is satisfied The contractor makes a profit | Economic conditions Demographic factors Political environment Other external influences directly or indirectly affecting the project These lie outside the project’s control but still determine whether it is judged a success. |
5. Scope: Philosophy, Planning and the Statement
Scope defines the total work required to execute a project and is the constraining factor within which the project must perform. In every project it has two distinct aspects: what the project is to deliver — the product or service deliverables, the objective — and the work that must be done to deliver it successfully.
Defining scope means capturing the client’s requirements and being explicit about what is included and what is not. That second half is routinely neglected and routinely expensive: a misunderstanding about deliverables can create havoc and disputes during execution or at closure. The product or service is broken into components and sub-components for clarity in what is called the Product Breakdown Structure (PBS).
Scope, illustrated by a dinner party
You decide to host dinner for a friend. Initiation is recognising the need to invite them. Scope planning is deciding whether to eat out or cook at home, and what food and drink to offer — decisions shaped by your budget, the closeness of the friendship, and the time available to cook. You finalise venue and menu, remembering your friend has a sweet tooth, so several desserts go in. That detailed description then decomposes into deliverables: drinks, salad, main course, desserts, coffee. That decomposition is the scope baseline.
What Scope Planning Produces
Scope planning is carried out to develop a written scope statement, which becomes the basis for all future project decisions. The actual scope is progressively elaborated and documented as more detail about the deliverables emerges. The scope statement must identify both the objectives and the deliverables, and it must include the criteria that will be used to determine whether the project or phase has been completed successfully. In effect it acts as an agreement of understanding between the project team and the customer.
The sequence is macro before micro: broad, high-level planning first, detailed planning afterwards. Scope planning also draws on the Project Charter and on the constraints and assumptions relevant to implementation — and that list of constraints and assumptions is not static, so it must be kept current throughout the life cycle.
Comprehensiveness matters here for two specific reasons: initial scope planning becomes the basis for all subsequent detailed planning, and a small error introduced at this stage magnifies many times over as the project progresses. The correction path is always longer than the original path — an error introduced early is typically detected considerably later, by which point extra work is needed simply to return to where you should have been.
| Scope Planning Tool | How It Is Used |
|---|---|
| Benefit / cost analysis | Weighs tangible and intangible costs against expected returns for different project and product alternatives. Financial methods such as IRR, NPV and payback period are used to assess the identified alternatives against the required scope. |
| Product analysis | Techniques including function analysis, value engineering and product breakdown analysis, used to understand every aspect of the product or service the project will deliver. |
| Alternatives identification | Systematically generating and comparing different ways of meeting the same requirement. |
| Brainstorming | Drawing on the collective knowledge of the team and stakeholders to surface requirements and tasks that individuals would miss. |
| Expert opinion and industry data | Bringing external judgement and benchmark data to bear on the scope definition. |
A separate Scope Management Plan should be drawn up describing how the total scope will be managed and controlled, and specifically how changes to scope will be identified, defined, classified, documented, managed and integrated into the project. The detailed Scope Statement is revised and refined as work progresses — but the manager and team must ensure that only approved changes are updated into the plan, and that every approved change is fully documented for future reference.
6. The Work Breakdown Structure
The WBS is the single most important structural tool in the planning toolkit. Tasks are divided into sub-tasks, which are decomposed further into more sub-tasks at increasing levels of detail until a task-oriented family tree exists. The number of levels depends on the complexity and size of the project, and the guiding aim is that tasks are broken into manageable packages.
Work that is not included in the WBS will not form part of the project.
WBS Levels and Numbering
| Level | Numbering | What Sits Here |
|---|---|---|
| 1 | 1.0 | The top level — a single task, which is the project itself. |
| 2 | 1.1, 1.2, 1.3 | Based on phase (Concept, Design, Test), on product (a tangible deliverable such as software or hardware), or on organisation (Finance, Sales, Marketing, Engineering). Phase-based level 2 is common, but all three can be combined in one WBS, and many practitioners recommend basing the top two or three levels on deliverables. |
| 3 | 1.1.1, 1.1.2 | Subdivision of each level 2 task. Task 1.1 is the parent of 1.1.1, 1.1.2 and 1.1.3. |
| Lowest | — | The work package — a group of activities. At this level it must be possible to assign the work, estimate its duration and cost, and track progress. |
Deciding how many levels to use is a judgement call with a clear test. Too many levels make control and execution cumbersome; too few prevent proper assignment and control. The test is this: can you develop cost and duration estimates at this level? If not, decompose one level further and ask again, repeating until the answer is yes. The level of detail reached should allow each task to be assigned and delegated to a specific department, team or individual.
Two structural rules govern the tree. Each level has a parent-child relationship: a parent task finishes only after all of its children are complete, and each parent should have more than one child for the breakdown to be meaningful. And each task should have at least one clearly defined, measurable deliverable, so there is never any doubt about whether it is complete.
Drawing the WBS
The WBS should be produced very early. It is drawn by the project team from their collective experience, supplemented by brainstorming with other stakeholders to surface every possible task. The first draft will almost certainly not capture everything, so it must be reviewed repeatedly, with missing activities added each time. This progressive refinement as the project becomes clearer is known as the rolling wave effect.
| TOP-DOWN Approach | BOTTOM-UP Approach |
|---|---|
| Tasks are broken up starting from the project and working downwards. Requires some past expertise to do well. | All required tasks are listed first, then organised into a structure. Useful where the team knows the work but not the shape. |
| A combination of both approaches is also perfectly valid — whichever route is taken, the total scope of the project must be reflected in the finished WBS. | |
Why the WBS Earns Its Central Position
| Benefit | Explanation |
|---|---|
| Planning framework | It forms the framework for planning the entire project, and is equally useful on the largest and smallest projects. |
| Work allocation | Breaks total work into small manageable packages allocated to the most appropriate person or team; used to assign work and track progress. |
| Accurate costing | Its lowest level supports accurate bottom-up cost allocation reflecting every activity, which then feeds the cost breakdown structure. |
| Scheduling basis | Makes duration estimation easier and forms the basis for the network schedule and the bar charts. |
| Earned value | Provides the budget, schedule and resource data required for determining earned value criteria. |
| Risk management | Risks attached to specific activities become far easier to identify; a risk factor can be added to individual tasks to help build a risk register. |
| Shared clarity | Gives team members and stakeholders a common understanding of the work and of the total project; helps identify key milestones and deliverables. |
| Parent of other structures | It is the basis for developing the Organisational Breakdown Structure, the Risk Breakdown Structure, the Communication Breakdown Structure and the Cost Breakdown Structure. |
The Work Package
The work package is a group of related tasks defined at the lowest level of the WBS, and it is the level at which the project is actually managed. Each work package is further broken into activities for the network that can be budgeted, defined, scheduled and controlled. Each has scheduled start and finish dates and a budget assigned to it, time-phased across its duration. Each is distinguishable from every other, and each should carry a narrative description of the scope of effort so the work is unambiguous. A work package either has a limited duration — roughly 80 hours is the usual guide — or it can be divided into measurable milestones. Work package schedules are then integrated with higher-level schedules.
7. Project Network Diagrams
Delivering on time and within budget without compromising quality is the permanent challenge, and optimal scheduling of activities plays a decisive role in meeting it. Project networks are the basic tool for detailing every activity required, sequencing them properly, and drawing them as a connected series so that the minimum total project duration can be calculated and progress monitored against that target.
Before drawing anything, it helps to be precise about what an activity is. Within a project an activity is the lowest level of effort that consumes time and resources; it has a definable start and finish; and it performs a part of the total work package. On the perennial question of whether a task differs from an activity, there is no consensus in the profession — some application areas treat activities as composed of tasks, others treat tasks as composed of activities, and many treat them as interchangeable. The practical position is that the terms are interchangeable and the context is what matters.
Two Methods of Drawing the Network
| Arrow Diagramming Method (ADM) | Precedence Diagramming Method (PDM) | |
|---|---|---|
| Also known as | Activity-on-Arrow (AOA) | Activity-on-Node (AON) |
| Activities shown as | Arrows | Nodes or boxes |
| Nodes represent | Events. A circular node consumes neither time nor resources. The arrow’s tail leaves one node; its tip enters another. | The activities themselves, with arrows showing only the logical relationships between them. |
| Dummy activities | Required, to express certain dependency logic that arrows alone cannot capture. | Not required. |
| Dependency types | Finish-to-Start only. | All four types — F-S, S-S, S-F and F-F. |
8. The Four Dependency Types
Take two activities, A and B, where B depends on A. Activity A can either have started or have finished; on that basis B can either start or finish. Two states multiplied by two states gives four logical combinations — and those four combinations are the complete set of dependency relationships available in project scheduling.
The naming convention is worth decoding once and remembering. The first letter describes the position of the independent activity A. The second letter, after the hyphen, describes the dependency of activity B. S stands for Start and F for Finish.
| Code | Name | The Rule | Examples |
|---|---|---|---|
| F–S | Finish to Start | A must finish before B can start. By far the most common — roughly 70–80% of all dependency relationships in a typical project. | Sit in car, then start car Pour the concrete, then raise the frame Define user requirements, then write the software Cook food, then eat food |
| S–S | Start to Start | A must start before B can start. | The Prime Minister must begin eating lunch before the other guests may begin eating theirs. |
| S–F | Start to Finish | A must start before B can finish. | The rarest of the four. The incoming shift must start before the outgoing shift can finish. |
| F–F | Finish to Finish | A must finish before B can finish. | Documentation cannot be signed off until the testing it documents has concluded. |
Lead and Lag
Consider pouring concrete into a mould to make a slab (activity A), then placing that slab on a column (activity B). The relationship is Finish-to-Start, but there is a complication: the mould must be left for a day to dry before the slab can be used. There are two legitimate ways to model this.
| Way 1 — Add an activity | Way 2 — Use a lag |
|---|---|
| Create an intermediate activity C representing the drying of the slab. The sequence becomes A, then C, then B. The setting time is now explicitly part of the network. | Insert a logical wait of one day between A and B. This is a lag of one day — the dependency still holds, but B’s start is deliberately delayed relative to A’s finish. |
A lag introduces waiting time into a dependency. A lead does the opposite — it allows a successor to begin before its predecessor has fully completed, overlapping work that would otherwise be strictly sequential. Both are legitimate scheduling devices, and both change the calculated project duration, so both must be applied deliberately rather than casually.
9. Critical Path Analysis
The Critical Path Method was developed in the 1950s by Remington Rand and DuPont as a tool for improving management control of maintenance projects. It is now used universally — construction, software, R&D, engineering, product development. To arrive at a critical path you need three things: a list of all activities required, the duration of each, and the dependencies between them.
The definition
The critical path is the longest path through the network, and it shows the earliest date by which the project can be completed. A project can have more than one critical path, and the critical path will generally shift over time as activities finish ahead of or behind schedule.
CPM works by sequencing activities in a logic diagram, then running two calculations across it. The forward pass computes each activity’s early start and early finish, working left to right through the network. The backward pass computes each activity’s late start and late finish, working right to left from the project end date. The difference between these two sets of dates gives each activity’s float — and the activities with the least float form the critical path.
Float and Its Two Formulas
Float, sometimes called slack, is the margin by which an activity can be delayed without pushing out the project end date. Take an activity whose early start is week 1 and whose late start is week 6. It can begin as late as week 6 rather than week 1 with no negative impact on the project’s finish date — it therefore carries five weeks of float.
Float = Late Start − Early Start
Float = Late Finish − Early Finish
Both formulas give the same answer. Since Late Finish = Late Start + duration and Early Finish = Early Start + duration, subtracting one from the other cancels the duration — which is constant for any given activity.
There is a subtlety that catches people out. If two consecutive activities B and C each show five weeks of float, that does not mean each can be delayed by five weeks independently. The float is shared along the path. Suppose B starts two weeks late because the assigned person was on leave. B’s duration is two weeks, so it now finishes in week 5 against a late finish of week 8 — leaving three weeks of margin, which passes to its successor C. C still has float, but the original five weeks has become three, because B consumed two of them. Float is a pool handed down a chain of activities, not a private allowance belonging to each.
Positive, Zero and Negative Float
Consider one project of eight activities, A through H, where the network calculates a duration of 20 weeks and the critical path runs A–E–G–H. Now vary only the imposed end date and watch what happens.
| Scenario | Imposed End Date | Float on Critical Path | What It Means |
|---|---|---|---|
| Calculated date accepted | Week 20 | ZERO | The normal case. No slack anywhere on the critical path. |
| Deadline relaxed | Week 24 | +4 weeks | Comfortable. The path still carries the least float in the network, so it remains critical. |
| Deadline compressed | Week 18 | −2 weeks | The project is already behind before it starts. Negative float is a formal signal that the schedule is not achievable as drawn. |
The point common to all three scenarios is that the critical path activities do not change. A–E–G–H remains the longest path through the network regardless of what date is imposed on it. What changes is the float carried by that path — zero, positive or negative. The critical path is defined as the longest path with the least float, and it keeps that identity even when the least float happens to be a comfortable four weeks.
10. The Gantt Chart
Over the past two decades arrows linking the bars have been added to Gantt charts to show dependencies, and project management software now displays those interdependencies automatically, letting you see how a delay in one activity ripples into others. A word of caution though: where too many links are present, the chart becomes difficult to decipher, which defeats the purpose entirely.
Floats are usually depicted as a single line drawn after the bar, so an activity with slack looks visibly different from one without. The important operating rule is that a Gantt chart is generally used for summary-level activities. For the details of individual activities and the logical dependencies between them, you must go back to the network.
| Why Gantt charts remain so popular | |
|---|---|
| Extremely easy to draw | Minimal effort compared with constructing and calculating a full network. |
| Easy to read and understand | Requires no training to interpret, unlike a network diagram. |
| Clear picture of status | Planned schedule versus actual progress can be seen at a single glance. |
| Suits senior audiences | Executives want to be briefed in the minimum possible time, and dozens of activities can be summarised in a single bar. |
| Easy to change | Revisions are quick, making it practical for frequent reporting. |
| Least complex reporting method | The simplest available means of communicating project progress. |
What to Take Away
Planning is the foundation of control. Without a plan there is no target to control against — and the purpose of planning is to reduce mid-course changes, because changes convert directly into delays and overruns.
The plan answers six questions: why, what, who, when, how, and how much. It is iterated repeatedly rather than written once, and it becomes the project’s baseline once the sponsor approves it.
Success is defined by the beholder. Sponsor, customer and team each judge the same project by different criteria, so those criteria must be agreed with everyone before work begins.
Work not in the WBS is not in the project. Decompose until you can estimate cost and duration at a level, then stop. That level is the work package, and it is where the project is actually managed.
Finish-to-Start covers most of the network — 70 to 80 per cent of dependencies — but the other three types exist for good reasons, and lead and lag let you model waiting and overlap without inventing artificial activities.
Float is shared, not owned. Consecutive activities showing the same float draw on the same pool; whatever the first one consumes, the next one loses.
Every technique above serves a single purpose: converting a general intention into a set of specific, assigned, estimated, sequenced commitments that a team can actually execute and a manager can actually control. Get the scope right and the WBS complete, and the schedule largely builds itself. Get them wrong, and no amount of network analysis downstream will rescue the project.