
Inventory Energy Use
Inventory Energy Use
Mapping Where, How Much, and How Fast Your Facility Consumes Energy
Understanding the Energy Inventory
Two of the most essential tools for fully assessing any facility are the demand profile and the load inventory, Inventory Energy Use. These two tools are deeply complementary — together they describe, in quantitative detail, every system that consumes energy within a facility. While the demand profile shows energy consumption over time, the load inventory answers the more fundamental questions: where is energy being used, how much does each system consume, and how fast does it draw power?
Understanding how the total energy load is distributed among various systems transforms an energy audit from a general exercise into a precise, targeted investigation. The load inventory is a systematic way of collecting and organising this information. It is also an indispensable tool for undertaking “what if” assessments — estimating the impact that retrofits, operational changes, or new technologies would have before committing to any investment.
💡 Core Principle: The load inventory and the demand profile work together. The inventory tells you what is consuming energy; the demand profile tells you when. Together, they give you a complete picture of your facility’s energy behaviour.
The Electrical Load Inventory
Making a complete list of all electrical loads in a facility directly answers two fundamental questions: where is electricity used, and how much and how fast is it used in each category? The process of identifying these categories of use alone is often enough to surface waste, and frequently leads directly to low-cost savings opportunities.
Identifying high-consumption loads lets you prioritise the most impactful savings opportunities first. Because the inventory also quantifies the demand — the rate at which electricity is drawn — associated with each load or group of loads, it becomes invaluable for interpreting and validating the demand profile.
Compiling the Inventory — Step by Step
To begin, choose a time period corresponding to your utility billing cycle — typically one month, though it can be a day, week, or year. Select a period that reflects typical operations. Then determine the actual peak demand in kW and the total energy consumption in kWh for that period, drawing from your utility bill.
Next, identify the major categories of electricity use across the facility. A physical walkthrough is often the most reliable approach — list categories as you encounter them. When classifying loads, consider both the type of electricity use and the activity taking place in each area. Grouping loads with similar operational patterns makes later analysis significantly easier.
The two most common methods for calculating individual load consumption are the motor load method — which estimates electrical loads from motor horsepower, loading, and efficiency — and the nameplate or measured connected kW method, which estimates power consumption from the nameplate rating or a direct power measurement. Once all loads across all categories are inventoried, the totals should be reconciled against the utility-billed figures for the selected period. Pie charts generated from the summary data are a particularly effective way to communicate the distribution of energy use to stakeholders.
⚙️ Motor Load Method
Estimates electrical load from motor horsepower, percentage loading, and motor efficiency. Ideal when direct power measurements are not available. Applies a diversity factor to convert connected load to peak demand.
🔌 Nameplate / Measured kW Method
Estimates consumption directly from the nameplate rating of each piece of equipment, or from an actual power measurement using a handheld meter. Preferred when nameplate data is accessible and reliable.
The Thermal Energy Inventory — Mapping Energy Flows
Identifying thermal energy flows throughout a facility is made most effective through an energy flow diagram. A well-constructed diagram shows all energy entering the facility, all energy leaving to the environment, and all significant flows occurring internally between systems. The purpose is not to describe processes in engineering detail — it is to illustrate the movement and transformation of energy at a systems level.
A critical principle underpins this exercise: the sum of all energy outflows must equal the sum of all purchased energy inflows. When this complete picture is assembled, opportunities for energy reduction and heat recovery often become self-evident — visible simply from the relative magnitude of individual flows.
Common Thermal Energy Outflow Types
| Energy Flow Type | Example | Typical Equipment or Function |
|---|---|---|
| Conduction | Walls, windows | Building structure and envelope |
| Airflow – Sensible | General exhaust | Exhaust and make-up air systems, combustion air intake |
| Airflow – Latent | Dryer exhaust | Laundry, pool ventilation, process drying, equipment exhaust |
| Hot or Cold Fluid | Warm water to drain | Domestic hot water, process cooling water, water-cooled compressors |
| Pipe Heat Loss | Steam pipeline | Steam pipes, hot water pipes, any thermally uninsulated pipe |
| Refrigeration Output | Cold storage | Coolers, freezers, process cooling, air conditioning systems |
| Steam Leaks & Vents | Steam vent | Boiler plant, distribution systems, steam appliances |
Energy Inventories and the Energy Balance
A fundamental principle underlying any rigorous energy audit is that all energy inputs must balance against all energy outputs. Once the thermal inventory is complete, this principle can be tested quantitatively: the energy inflows — purchased fuel, electricity, and any recovered heat — should equal the sum of all identified outflows, including useful work, heat losses, exhaust, and waste streams.
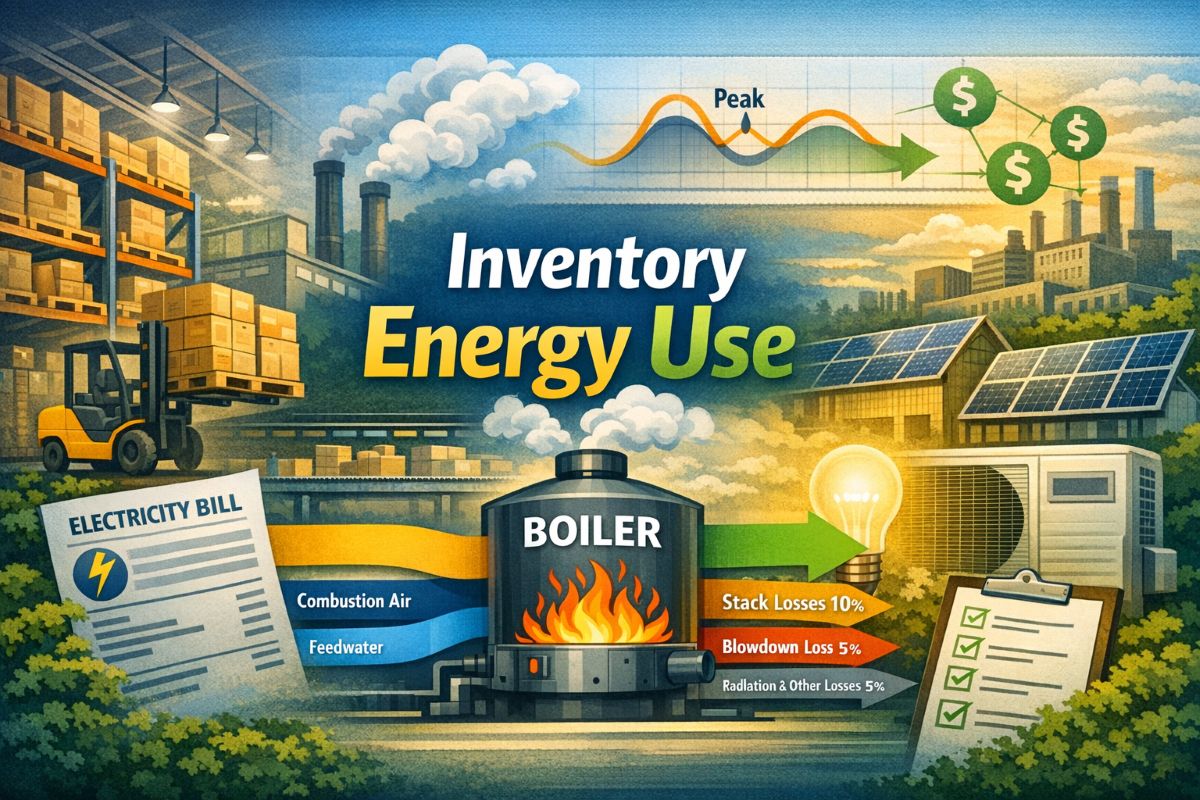
A particularly effective way to visualise this balance is the Sankey diagram. In a Sankey diagram, the width of each arrow represents the magnitude of the energy flow it depicts, and arrows are arranged to show the sequence in which energy is transformed and eventually lost. A boiler Sankey diagram, for instance, shows fuel energy entering on one side, with useful steam output represented by a wide arrow and flue gas losses, blowdown losses, and surface radiation depicted as progressively smaller arrows branching off. At a glance, it communicates where the largest losses occur and therefore where the greatest savings potential lies.
Building envelope analysis is another thermal balance exercise that yields direct savings insights. Calculating heat loss through windows, walls, roofs, and ventilation systems — accounting for internal heat gains from occupants, lighting, and equipment — produces a clear breakdown of where space-heating energy actually goes. This breakdown is the foundation for prioritising envelope improvements and HVAC optimisation.
Finding Savings Opportunities in the Inventory
Both the electrical load inventory and the thermal energy-use inventory are excellent starting points for identifying savings. The process of evaluating how energy is distributed across systems often unearths potential improvements that would otherwise remain invisible. For every piece of equipment or group of loads, the key questions are: Is it running when it needs to be? Is it sized correctly for its task? Can it be made more efficient?
Thermal Inventory — Reducible vs. Recoverable Flows
When examining thermal outflows, it is important to classify each flow as either reducible or recoverable, as the savings strategy differs significantly between the two. A reducible flow is directly tied to purchased energy — cutting it directly reduces your energy bill. Adding insulation to a building wall reduces conductive heat loss and directly lowers heating fuel consumption. Tightening ventilation schedules reduces the energy needed to temper fresh outdoor air.
A recoverable flow, by contrast, is waste heat that cannot be eliminated but whose thermal value can be captured and redirected. Cooling water from a water-cooled air compressor is a classic example — the heat cannot be prevented, but the warmed water can be used to pre-heat domestic hot water or process make-up water, effectively displacing purchased energy that would otherwise be used for that purpose. This is the principle of heat recovery, and it represents some of the most cost-effective opportunities available in industrial and commercial facilities.
Electrical Inventory — Key Analytical Lenses
- Diversity Factor: A high diversity factor for a load indicates it is contributing heavily to peak demand. Assess whether this is operationally necessary or whether scheduling adjustments could reduce the peak contribution.
- Operating Hours: Loads with long validated operating hours are prime candidates for efficiency improvement — higher-efficiency motors, lamp upgrades, or variable-speed drives may offer strong returns.
- Load Grouping: Where large groups of loads operate together simply because they are switched as a unit, consider whether sub-zoning is feasible. Lighting is the most common example — zoning by occupancy sensor, time clock, or photocell is often straightforward and highly cost-effective.
- Night Load: Cross-reference the electrical inventory against the demand profile. Can every load running during unoccupied hours be justified? Night loads are frequently the result of oversight rather than operational necessity.
- Load Flexibility: Assess the degree to which the pattern of electrical use can be shifted to lower-cost time periods. For facilities on time-of-use or real-time pricing, shifting flexible loads — such as refrigeration cycling, batch processes, or EV charging — away from peak pricing windows can yield significant cost reductions without any reduction in output.
Key Takeaways — Inventory Energy Use
- The electrical load inventory reveals where electricity is used, how much each system consumes, and how fast it draws power — making it essential for any serious audit.
- Two calculation methods — motor load and nameplate/measured kW — cover the vast majority of load types encountered in real facilities.
- The thermal energy flow diagram provides a systems-level map of all energy entering and leaving the facility, exposing losses that are otherwise invisible.
- All energy inflows must balance against all outflows — the Sankey diagram makes this balance visible and immediately communicates where the largest losses occur.
- Thermal outflows are either reducible (cut them to save purchased energy) or recoverable (capture their heat value to displace other purchased energy).
- Electrical loads should be analysed for diversity factor, operating hours, grouping, night-load justification, and flexibility — each lens can reveal a distinct category of savings.
Source: Energy Audit Manual & Tool · Inventory Energy Use · Natural Resources Canada