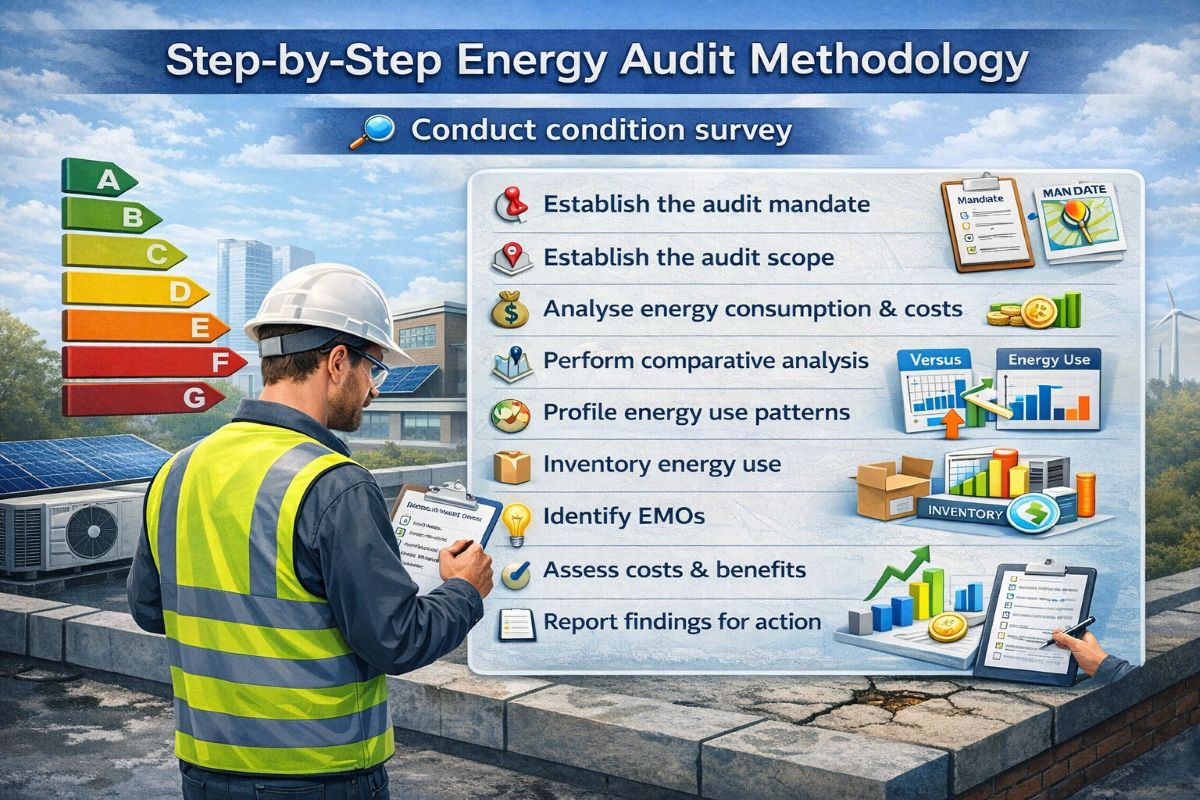
Step-by-Step Energy Audit Methodology
⚙️ Step-by-Step Energy Audit Methodology: The Complete Industrial Roadmap to Finding Real Savings
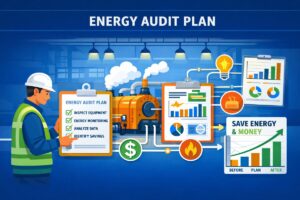
An energy audit becomes powerful only when it follows a clear, structured Step-by-Step Energy Audit Methodology. Random observations, scattered measurements, and incomplete spreadsheets rarely produce meaningful results, but a step-by-step audit process can reveal where energy enters a facility, how it is consumed, what drives that consumption, and where the biggest savings opportunities lie.
For industrial plants, the audit methodology is not just a checklist. It is a disciplined path that moves from visual observation to data analysis, from plant behavior to engineering logic, and finally from findings to action. If you want reliable energy-saving decisions instead of guesswork, you need a method that is practical, repeatable, and rooted in real plant conditions.
🌟 Why Methodology Matters
A good energy audit is not a single activity. It is a sequence of linked steps, where each stage produces inputs for the next stage and gradually builds a full picture of facility energy use. The process begins with a condition survey and ends with a report for action, while several steps in between can already reveal Energy Management Opportunities, or EMOs.
This structured approach matters because energy systems are interconnected. A problem seen in the load inventory may actually be caused by operating patterns, poor benchmarking, or utility tariff issues found earlier in the audit. Without methodology, an auditor may notice symptoms but miss the real cause.
🧭 The Ten-Step Route
The audit methodology described for industrial facilities includes 10 key steps, each with a specific purpose and each contributing different types of data, analysis, and outputs. Some of the steps identify savings opportunities directly, while others help define whether a more detailed micro-audit is needed for deeper engineering analysis.
Here is the practical flow:
🔎 Conduct a condition survey
📌 Establish the audit mandate
🗺️ Establish the audit scope
💰 Analyse energy consumption and costs
📊 Perform comparative analysis
⏱️ Profile energy use patterns
📦 Inventory energy use
💡 Identify EMOs
📈 Assess costs and benefits
📝 Report findings for action
This order is important because each step builds understanding at a different level, starting broad and becoming more detailed as the audit progresses.
🔎 Step 1: Condition Survey
The condition survey is the first field-based step in the methodology. Its purpose is to identify the most likely locations for audit attention, point out obvious energy waste, and reveal EMOs that can sometimes be implemented immediately without deeper analysis.
It also helps set priorities for the audit mandate and scope by providing an early sense of which systems are poorly maintained, poorly controlled, or simply wasteful. The main data required here is visual inspection of representative areas and equipment, and the result is a relative assessment of the condition of each major energy-consuming system in the facility.
📌 Step 2: Audit Mandate
The audit mandate establishes and articulates the purpose of the audit. It secures stakeholder input and commitment, and it clarifies what the organization expects the audit to achieve in terms of savings analysis, system coverage, and related outcomes such as operations, maintenance, or environmental benefits.
This step relies on input from senior management, production teams, maintenance staff, and an understanding of constraints in timing, resources, and access to facilities. The result is a clear statement covering audit location, extent of analysis, type of EMOs expected, and the level of savings evaluation required.
🗺️ Step 3: Audit Scope
Once the mandate is clear, the next task is to define the physical extent of the audit by setting the system boundary around the energy-consuming system being assessed. The scope identifies which energy inputs cross that boundary, which subsystems are included, and what information and analysis methods will be used.
This step requires the results of the condition survey, the location of all energy inputs, and lists of major energy-consuming systems. Its main result is a specification of the audit boundary in terms of input energy flows, energy-consuming systems, and indirectly the related energy outflows.
💰 Step 4: Energy Costs
The fourth step tabulates all purchased and non-purchased energy inputs and establishes both the annual pattern of energy consumption and the total annual consumption. It also helps reveal the relative annual cost of each purchased energy form and the incremental or marginal cost of electricity demand, electrical energy, natural gas, or other fuels.
The required data here includes utility bills for each purchased energy source, metered data for other inputs, and applicable utility rate structures. This stage is especially important because later savings calculations depend heavily on understanding the tariff structure, cost components, and the difference between the average and incremental energy cost.
📊 Step 5: Comparative Analysis
Comparative analysis places your facility’s energy performance in context. It compares current performance with historical internal performance as well as external benchmarks, and it provides insight into the major drivers of energy consumption and the relative savings potential that may exist.
This step needs periodic energy consumption data plus periodic data for important drivers such as production, weather, or occupancy. The outputs include relationships between energy use and significant drivers, trends in consumption, preliminary reduction targets, and a first estimate of how much improvement may be realistically achievable.
⏱️ Step 6: Energy Profiles
Profiling energy use patterns develops an understanding of the time patterns in which the facility consumes energy. This can include logged data over intervals ranging from one minute to one day for electrical power, gas flow, temperature, humidity, light level, airflow, pressure, and other measurable factors.
The results are extremely valuable because they can show abnormal energy use conditions that are not obvious from monthly bills alone. Profiling can also reveal savings potential in reducing consumption variability and can help disaggregate energy use when combined with the energy inventory that comes later.
📦 Step 7: Energy Inventory
The energy inventory stage provides a clear picture of where energy is being used. It breaks energy consumption down by major areas of use, such as gas for production versus space heating or electricity for process systems, ventilation, compressed air, lighting, and conveyance.
The data needed includes facility and equipment drawings, specifications, equipment inventory and nameplate data, power and fuel consumption, measured flow rates, temperatures, and other operating values. This step is one of the strongest foundations for identifying waste because it shows the actual distribution of energy use across the plant in a structured way.
💡 Step 8: Identify EMOs
After the inventory and profiles are established, the audit moves into critical assessment of systems and energy consumption levels to identify Energy Management Opportunities. The methods here can range from open-ended engineering analysis to closed-ended checklists, depending on the type of facility and depth of the audit.
This step helps create a prioritized list of EMOs, separating those ready for immediate action from those that require further analysis through a more detailed micro-audit. It also helps harmonize the interaction between multiple EMOs so that combined savings are evaluated sensibly rather than double-counted.
📈 Step 9: Costs and Benefits
Once potential EMOs are identified, the methodology calls for a preliminary assessment of savings, implementation costs, and financial benefit. When several measures are possible, this step also accounts for interactions between them so that the net savings picture remains realistic.
The required data includes existing versus proposed energy consumption, incremental energy cost, and optional measurements of present conditions. The result is a practical financial picture of each EMO, including savings potential, implementation cost, and benefit that can guide prioritization and decision-making.
📝 Step 10: Report for Action
The final step is to report the audit findings in a way that facilitates action. The outcome should not be a vague technical document, but a succinct and compelling presentation that supports implementation across all EMO levels, from housekeeping improvements to capital-intensive retrofits.
The report should draw from every preceding step and typically includes an executive summary, analysis of existing energy consumption, description of identified EMOs, savings assessment for selected measures, and an implementation action plan. A well-written report is not the end of the audit; it is the bridge between analysis and real change.
🧩 What Each Step Needs
One of the strongest features of this methodology is that each step is linked to specific data, templates, and analysis tools. Condition surveys use checklists, audit mandate and scope use structured forms, utility analysis uses cost spreadsheets, comparative analysis uses monitoring data, and energy inventory relies on load inventory and thermal inventory methods.
The methodology also aligns each stage with practical tools such as condition survey templates, electricity and gas cost sheets, comparative analysis spreadsheets, profile worksheets, load inventory forms, EMO checklists, and report templates. This makes the process easier to standardize across plants and easier to repeat year after year.
🧠 Digging Deeper
For more detailed audits, especially micro-audits, the same methodology still applies but with greater intensity and tighter focus. A micro-audit usually defines a narrower boundary, requires more measurements, more metering equipment, more technical expertise, and often sets a higher standard of certainty because the findings may be used to justify financing or capital decisions.
In a more detailed audit, profiles can be measured for specific subsystems such as air compressors, refrigeration, compressed airflow, steam flow, pressure, or illumination levels. The energy inventory becomes more detailed, EMO definition becomes sharper, and the costs-and-benefits step usually becomes the main purpose of the investigation.
🔬 Macro vs Micro Thinking
At macro level, the methodology helps the plant see broad patterns, large losses, and opportunities that are operational or easy to implement. At the micro level, the same framework is used to examine a specific process or equipment item in much greater detail, often with direct sub-metering, more refined cost allocation, and more precise savings calculation.
This is why the methodology is so effective: it works for both big-picture facility reviews and tightly focused engineering studies. The difference is not the logic of the process, but the depth of detail, the quality of measurements, and the certainty required in the outcome.
🏭 A Practical Example
Imagine a plant with high electricity bills and rising gas consumption. If you skip straight to recommending equipment replacement, you may miss cheaper and faster solutions. But if you follow the full methodology, you might first notice poor maintenance in the condition survey, then define a scope around the most energy-intensive systems, then discover from cost analysis that demand charges are unusually high, and later find through profiling that major loads remain active during production downtime.
Then, once the energy inventory is prepared, you may learn that compressed air and ventilation account for much more consumption than expected. Only after that full picture emerges can EMOs be prioritized intelligently, costs estimated properly, and management given a report that supports immediate action as well as longer-term study.
🚀 Why This Method Works
This methodology works because it respects both plant reality and engineering logic. It starts from observation, moves into definition, develops data-driven understanding, and ends in structured decision support. It also recognizes that EMOs can appear at many stages, not just at the end, and that some opportunities deserve immediate implementation while others require deeper micro-audit work.
In other words, it is not just an audit sequence. It is an industrial learning process that helps a facility become progressively more energy aware, more analytical, and more capable of improving performance over time.
✅ Key Lessons
An energy audit works best when it follows a structured 10-step process that moves from survey to action.
Each step has a distinct purpose, from defining the mandate to quantifying benefits and preparing a practical report.
Different kinds of data are needed at different stages, including bills, logged measurements, equipment data, and staff input.
The process can identify EMOs at several points, not just after the final analysis.
The same methodology supports both macro-audits and micro-audits, with the main difference being the depth of detail.
🔔 What Comes Next
The step-by-step methodology gives you the master framework, but the real power comes when each stage is explored in detail. The next level is understanding how to carry out these individual steps with discipline, from condition surveys and mandate setting to load inventories and EMO evaluation.